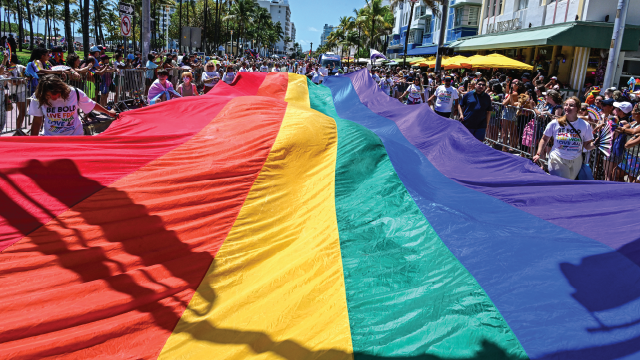
June is Pride Month in the United States. It celebrates the lives and contributions of LGBTQ Americans and commemorates the anniversary of the Stonewall Uprising.
Here are some key findings on how LGBTQ adults view Pride, based on a Pew Research Center survey conducted in January.
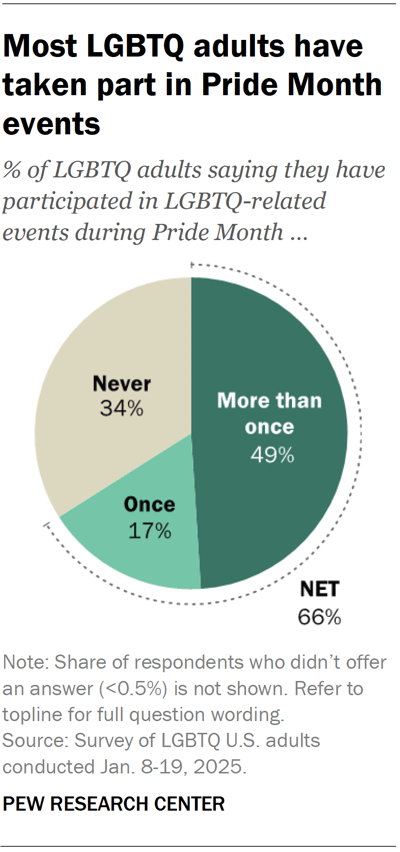
- 66% of LGBTQ adults say they have participated in LGBTQ-related events during Pride Month at least once in their lives. This includes 49% who say they’ve participated more than once.
- 68% say all or most companies that promote Pride are motivated to do so by business interests. Smaller shares say companies promote Pride because they feel pressured (35%) or because of a genuine desire to celebrate LGBTQ people (16%).
In addition, the survey explored LGBTQ adults’ knowledge of LGBTQ history in the U.S. and where they learned about it.
We also asked non-LGBTQ adults about Pride Month in a February survey.
Related: The Experiences of LGBTQ Americans Today
Who participates in Pride events?
LGBTQ adults
While majorities of LGBTQ adults say they have celebrated Pride at least once, certain demographic groups are more likely to say this than others.

Gay or lesbian adults (77%) are the most likely to say they have participated in Pride events at least once, and bisexual adults are the least likely (57%). About two-thirds of transgender adults (68%) say they have participated in Pride events. (In this analysis, gay, lesbian and bisexual adults exclude those who are transgender; transgender adults are of any sexual orientation.)
The shares of LGBTQ adults who say they’ve participated in Pride events also vary by:
- Education: 77% of those with a bachelor’s degree or more education have participated, compared with 60% of those with some college or less education.
- Partisanship: 71% of LGBTQ Democrats and Democratic-leaning independents have participated, compared with 47% of LGBTQ Republicans and Republican leaners.
Non-LGBTQ adults
Adults who are not LGBTQ are less likely to say they have participated in LGBTQ-related Pride events. Still, 16% of non-LGBTQ adults say they have participated, including 9% who say they’ve done this more than once.
Certain groups of non-LGBTQ adults are more likely than others to say they’ve participated in Pride:
- Those younger than 50 (23% vs. 9% of those ages 50 and older)
- Those with at least a bachelor’s degree (22% vs. 14% with some college or less education)
- Democrats (27% vs. 7% of Republicans)
Why do Americans think companies promote Pride?
LGBTQ adults
Many companies sell Pride-themed merchandise and express support for the LGBTQ community in other ways throughout June, although some have scaled back in recent years.
We asked about three separate reasons companies might promote Pride Month.

- A majority of LGBTQ adults (68%) say all or most companies that promote Pride Month do this because they think it will help their business.
- About a third (35%) say these companies promote Pride because they feel pressure to support LGBTQ people.
- Fewer (16%) say all or most of them have a genuine desire to celebrate LGBTQ people.
LGBTQ adults under 30 are the most skeptical that companies promote Pride because of a genuine desire to celebrate LGBTQ people. In this age group, 51% say only a few or no companies support Pride for this reason. This compares with 43% of LGBTQ adults in their 30s, 39% of those in their 40s, and 30% of those ages 50 and older.
These views also differ by party. LGBTQ Democrats are more likely than their Republican counterparts to say all or most companies that promote Pride do so because they think it will be good for their business (71% vs. 59%). In turn, LGBTQ Republicans are more likely than LGBTQ Democrats to say these companies feel pressure to express support (43% vs. 34%).
Non-LGBTQ adults
Similarly, non-LGBTQ adults are skeptical of the motivations of companies that promote Pride. Few non-LGBTQ adults (13%) say all or most of these companies do it out of a genuine desire to celebrate LGBTQ people.

A 54% majority of non-LGBTQ adults say all or most companies that promote Pride do it because they think it will help their business. And 45% say these companies feel pressure to support LGBTQ people.
Among those who are not LGBTQ, Republicans are far more likely than Democrats to say:
- All or most companies that promote Pride feel pressure to do so (61% vs. 30%)
- Only a few or none of these companies have a genuine desire to celebrate LGBTQ people (63% vs. 37%)
How much do LGBTQ adults know about LGBTQ history in the U.S.?
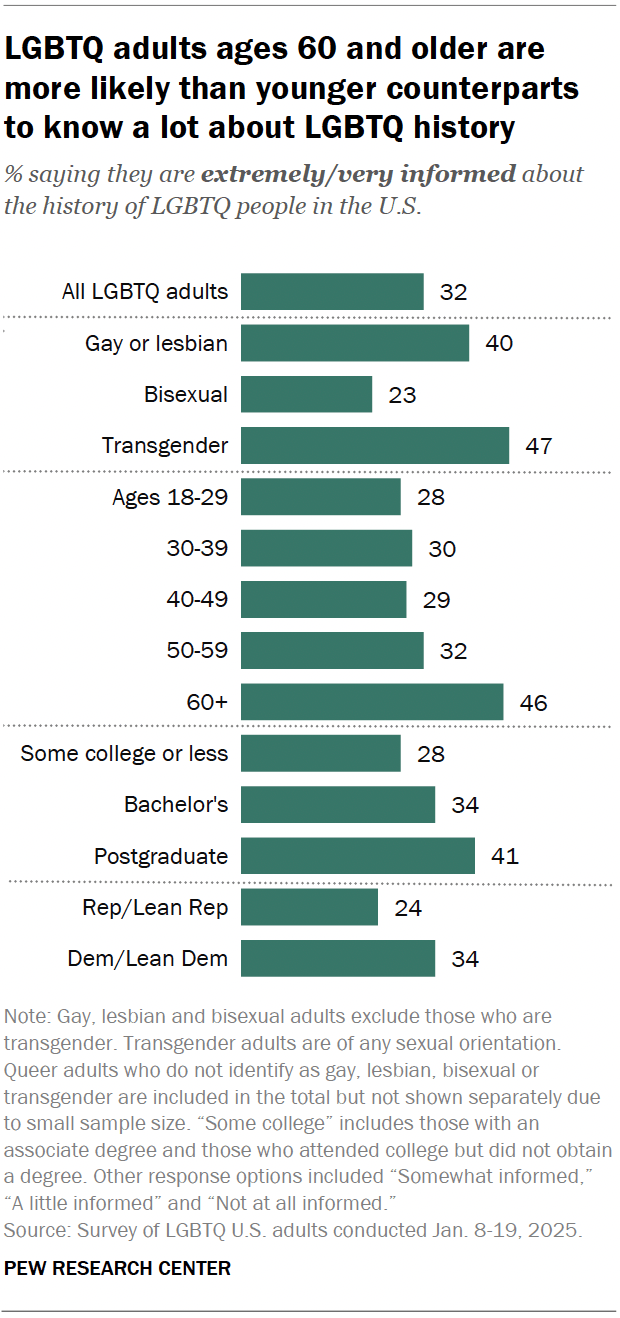
About a third of LGBTQ adults (32%) say they’re extremely or very informed about the history of LGBTQ people in the U.S. Another 44% say they are somewhat informed, and 24% say they are a little or not at all informed. However, there are several differences by LGBTQ group and other demographic characteristics.
Gay or lesbian (40%) and transgender (47%) adults are more likely than bisexual adults (23%) to say they are extremely or very informed about LGBTQ history.
LGBTQ adults ages 60 and older also stand out: 46% say they are extremely or very informed, compared with about a third or fewer in younger age groups.
There are also differences by education. LGBTQ adults with a postgraduate degree are more likely than those with a bachelor’s degree only to say they are extremely or very informed (41% vs. 34%). A smaller share of those with some college or less education (28%) say the same.
In addition, 34% of LGBTQ Democrats say they are extremely or very informed about this history, compared with 24% of LGBTQ Republicans.
Where do LGBTQ people learn about U.S. LGBTQ history?

Among LGBTQ adults who indicate they know about LGBTQ history, few say they learned a lot about it in school. Instead, the most common source is the internet or social media: 60% say they learned a great deal or a fair amount from these sources.
About half (51%) say they learned a lot from other LGBTQ people they know.
Smaller shares say they learned a lot about LGBTQ history from:
- Television or movies (38%)
- Books (36%)
- School (8%)
LGBTQ adults under 40 are more likely than their older counterparts to say they learned a lot about LGBTQ history from the internet or social media (66% vs. 50% of those ages 40 and older).
LGBTQ adults with a postgraduate degree are particularly likely to say they learned a great deal or fair amount about this history from books. About half (51%) say this, compared with 40% of those with a bachelor’s degree only, 35% of those with some college education, and 25% of those with a high school diploma or less.
